Surfaces
Fairly brief notes on isotherms and rates of reactions at surfaces. Also some experimental methods at the end. Not my favourite topic!
Surfaces Notes
Extent of Adsorption
Fractional Coverage (of adsorbate) –
θ = # of surface sites occupied / total # of surface sites.
Thus, θ = 1 is a monolayer.
θ can also be expressed in terms of volume of adsorbate adsorbed, as θ = V/V∞, where V∞ is the volume for a complete monolayer.
Physisorption
Van der Waals interaction between adsorbate and substrate. Long range but weak – energy released on physisorption approximately equals the enthalpy of condensation.
Such small energies can be absorbed as vibrations of the lattice and dissipated as thermal motion, and a molecule bouncing across the surface will gradually lose energy and finally adsorb onto it (accommodation).
Enthalpy of physisorption measured by monitoring rise in temperature of a sample of known heat capacity, and it usually is ~20kJ mol-1. No bond breaking occurs. Tends to be reversible as a result.
Examples include the molecular adsorption of noble gases and methane. ΔHophys > ΔHocond is due to the fact that there is always a surface potential at the interface between two different phases, and more especially solid-gas interfaces, whereby an “overspill” of electron charge from the solid into the gas phase results in an imbalance of electron density on either side of the interface. The resulting surface potential generates an additional bonding interaction which becomes more significant as the polarisability of the adsorbate increases.
Chemisorption
Molecules stick to the surface by a chemical (usually covalent) bond, and tend to find sites that maximise their coordination number with the substrate.
ΔH is much greater (~200kJ mol-1) and distance between the surface and adsorbate is typically shorter. The enthalpy of chemisorption depends strongly on the surface coverage of adsorbate, largely as a result of adsorbate-adsorbate lateral interactions.
A good example of this effect is the change in ΔHoad for CO adsorption on Pd(111) as a function of coverage. It is evident that as θ increases, a precipitous fall in the value of ΔH occurs at exact θ = 0.5. This is associated with the formation of an ordered superlattice of surface CO molecules. Further adsorption requires disruption of the ordered array and a decrease in the average separation of adsorbed CO molecules. Both effects destabilise the adsorbed layer relative to the low coverage phases (ΔH decreases as chemisorption proceeds).
A chemisorbed molecule may be torn apart by valence demands of the surface atoms (catalysis).
Except in special cases, chemisorption is exothermic, ΔG < 0 (spontaneous) and ΔS < 0 due to loss of freedom, therefore ΔH must be negative for ΔG to be negative.
Exceptions to this are those with high translational mobility on the surface, e.g. H2 on glass – H2(g) → 2H(glass).
Enthalpy depends on the extent of surface coverage, as adsorbate particles interact (repel implies less exothermic).
|
Chemisorption |
Physisorption |
|
Monolayer |
Can give multilayers |
|
Specific – substrate, crystal face |
Non-specific |
|
Room temperature – very long lifetimes |
Room temperature – short lifetimes |
|
Chemical change |
No chemical change |
Langmuir Adsorption Isotherm
The number of surface sites occupied at equilibrium at a fixed temperature depends on the gas pressure, p. This is an isotherm.
At very low p, they are linear and obey Henry’s Law:
p = kθ.
Langmuir Isotherm interprets the equilibrium behaviour and can be used to determine the total surface area.
Approximations used:
- Each surface is uniform and contains a number of equivalent sites, each of which can only be occupied by one molecule.
- Dynamic equilibrium exists between the gas and adsorbed layer at constant T.
- Adsorbate molecules are continually colliding with surface from the gas phase. If they impact they form a bond and stick. If they strike a filled site, they bounce off.
- Once adsorbed, molecules are localised (don’t move about on surface), and the enthalpy of adsorption remains constant irrespective of coverage.
Dynamic Equilibrium:

A(g) + M(surface) ⇌ AM(surface)

The rate of change of surface coverage due to adsorption is proportional to partial pressure of A and number of vacant sites – N(1-θ) where N is the total number of sites.

Rate of change of desorption is proportional to the number of adsorbed species, Nθ:

At equilibrium, no net change (sum of these two rates = 0). Solving for θ:

Note: K is often written as B, and θ as x/xm (xm is the mass corresponding to complete coverage).
Then,

i.e. p/x vs. p is a straight line, with gradient 1/xm.
For adsorption with dissociation, the rate of adsorption is proportional to p and the probability that both atoms will find sites (square of the number of vacant sites):

Similarly, the rate of desorption is proportional to the frequency of encounters of atoms on the surface, therefore 2nd order in the number of atoms present:

Hence,

Surface coverage depends more weakly on p than for the non-dissociative case.

Heats of Adsorption
Temperature Dependence can be used to determine the isosteric enthalpy of adsorption, ΔadHo (fixed coverage).
The adsorption of a gas on a solid is an exothermic process. Furthermore, both the magnitude and variation as a function of coverage of the heat evolved during adsorption may reveal information concerning the type of bonding exhibited by the adsorbate to the surface and also evidence of lateral interactions between adsorbed species.
It should be noted that it does not necessarily follow that the heat of adsorption will be independent of coverage. As molecules of adsorbate pack closer together on the surface with increasing coverage, some lateral interactions will result, which will change the heat of adsorption. A new function can be defined that takes into account possible changes in the heat of adsorption as θ varies. For the equilibrium:
ΔGoad = - RT log Ko = ΔHoad – TΔSoad
log Ko =

Differentiating with respect to T:
(this is the Van’t Hoff Isochore)

Note that: Kp = θ / (1-θ), and constant θ → ln K + ln p = constant.
Hence,

Therefore a plot of ln p vs. 1/T – straight line with slope ΔH/R.
BET Isotherm
If the initial adsorbed layer can act as a substrate for further adsorption, then instead of isotherm levelling off it can be expected to rise indefinitely.
Multilayer adsorption is best handled by the BET Isotherm:

p* is the vapour pressure above a layer of adsorbate that is more than one molecule thick, and resembles a pure bulk liquid.
Vmon is the volume corresponding to monolayer coverage, and C is a constant which is large when the enthalpy of desorption from a monolayer is large compared to the enthalpy of vapour of a liquid adsorbate:

Shapes of the BET Isotherm:

Also, it is commonly written as:

In the limit p << po and for large C,

Hence,

Equivalent to the Langmuir Isotherm with B = C.
This is because at very low pressure, only a monolayer will form.
Rates of Surface Processes

Potential energy of a molecule varies with distance from the surface.
As the molecule approaches the surface, its energy falls as it becomes physisorbed into the precursor state for chemisorption. Dissociation into fragments often takes place as a molecule moves into its chemisorbed state, and after an initial increase of energy as the bonds stretch, there is a sharp decrease as the adsorbate-substrate bonds reach their full strength. Even if the molecule does no fragment, there is likely to be an initial increase of potential energy as bonds adjust as molecule approaches the surface.
Therefore, expect a potential barrier separating the precursor and chemisorbed states. This barrier may be low (< Energy of distant, stationary particle) → activation-less (rapid chemisorption). This is true for many gas→clean metal.
Hence, rates are bad for distinguishing chemisorption and physisorption (latter is slow on a porous medium).
Rate of Adsorption –
Depends on the ability of the substrate to dissipate the energy of the incoming particle.
Proportion of collisions with surface that lead to adsorption is the sticking probability, s.

The numerator can be measured by observing the rate of change of p. The denominator can be calculated from the Kinetic Theory of Gases.
Also, s depends on the number of free sites, so:
s = (1-θ)s0.
Where θ is the fractional coverage, and s0 is s for a perfectly clean surface.
Rate of Desorption –
Always activated process – move particles from trough of a potential well.
Expect,

Where Ed approximately equals the enthalpy of physisorption.
Therefore the half-life for the remaining surface:
t1/2 = ln 2 / kd.
This has a temperature dependence.

Catalysis –
Alternative reaction path with lower activation energy. Only changes the rate, not the position of the equilibrium. Many depend on co-adsorption of two or more species.
Langmuir-Hinshelwood Mechanism:
Reaction takes place by encounters between molecular fragments and atoms on a surface.
A + B → P, v = kθAθB
Deriving the Langmuir Isotherm in this case:
M(surface) + A(g) ⇌ AM(surface)
M(surface) + B(g) ⇌ BM(surface)
With both equilibria occurring simultaneously.
Desorption depends only on the proportions A or B (as for standard Langmuir case).
Hence,

And similar for B.
Equating rates and rearranging:

As θ = θA + θB,

Studying Surfaces
Role of Defects

It is unlikely that a surface will be a perfectly flat; it will probably have steps, terraces, etc. Hence, interaction with several atoms at once rather than just the one directly below is possible.
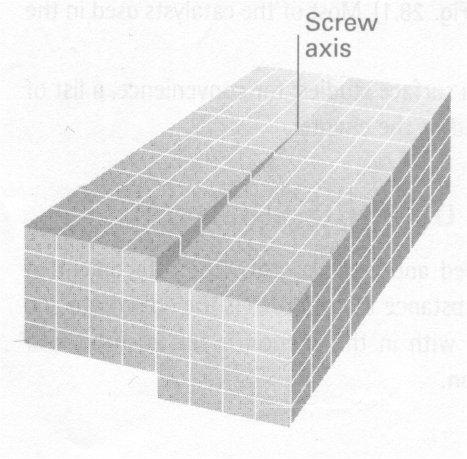
Dislocations: a discontinuity in the regularity of the lattice as a whole, e.g. screw dislocation.

Single Crystal Surfaces
Single crystals = well-defined surfaces for experiment. Can cut through crystal planes, defined by Miller Indices. This consists of 3 integers (x,y,z) for materials adopting bulk cubic materials.
As an example, consider the (011) plane of a simple cubic lattice (shown right).
To confirm that this is indeed a (011) plane, the following operations are performed:
- Decide where the plane intercepts the x, y and z axes in multiples of the unit cell dimension, a. Here it intercepts at ∞, 1, 1.
Note that the intercept of the plane with the x axis is at infinity since the plane runs parallel to it. If a negative intercept happens to result, this is indicated by placing a bar above the index.
- Take the reciprocal values of these intercepts, which gives 0, 1, 1.
- If fractions result from step (ii), reduce the three indices to the equivalent ratio of whole numbers. For example, if step (ii) gave (⅓, ⅔, 1) then the correct Miller Index would be (1,2,3).
Some examples:
FCC – BCC –

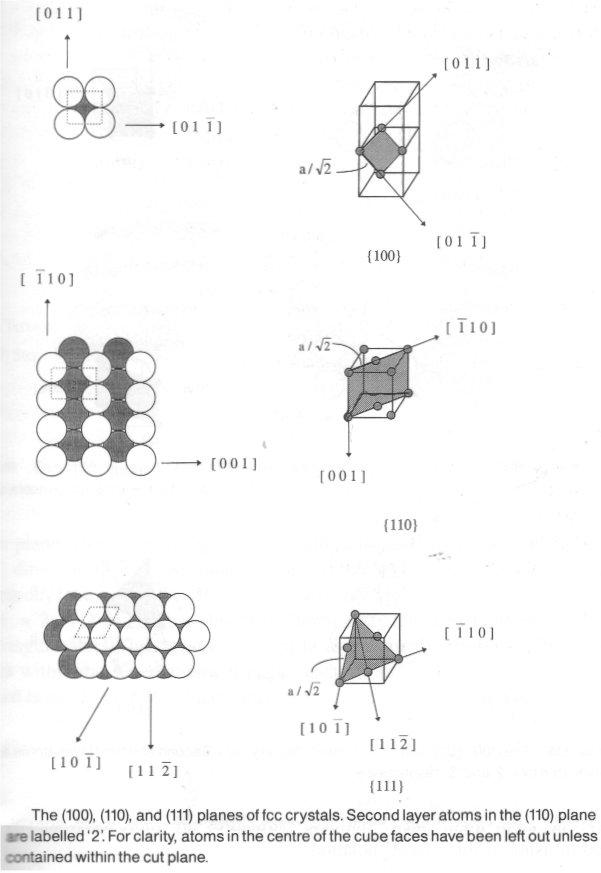
The majority of surfaces exhibit variations in periodicity both perpendicular and parallel to the plane associated with the loss of coordination of atoms at the interface. For example, in the case of the low index FCC surfaces shown above, atoms in the (111), (100) and (110) FCC planes have 9, 8, or 7 nearest neighbours compared with their normal coordination number of 12 in the bulk. In order for the surface to compensate for the loss of bonding, it may undergo surface relaxation in the form of an oscillatory change in the interplanar spacing. Surface relaxation occurs since, as the first layer atoms contract towards the second layer to increase their coordination, third layer atoms respond by expanding away from second layer atoms, hence compensating for the overcoordination of the second layer. This oscillation in the spacing penetrates deeper into the surface until eventually it is completely damped. The region of the surface that may be distinguished from the bulk will typically be 5-6 atomic layers thick at most, and is termed the selvedge. Surface relaxation is, in general, largest for low atomic density (more open), high energy surfaces.
If the surface energy is sufficiently large, not only will surface relaxation occur but also gross re-structuring of the surface plane, usually to enhance the coordination of surface atoms and, hence, to achieve a lower surface energy. When simple truncation of the bulk crystal does not lead to the expected surface periodicity, the effect is termed surface reconstruction. The (110) plane of gold illustrated which reconstructs when clean to a “missing-row” structure associated with removal of alternate close-packed atomic rows.

Because the periodicity of the reconstructed surface is doubled in one direction, it is referred to as a (1x2) reconstruction. It is interesting to note that, although reconstruction increases the effective surface area (and hence the surface energy) of the gold, this increase is offset by the fact that the surface now consists of (111) microfacets of low surface energy. Surface reconstruction is particularly common in semiconductors, which tend to exhibit more localised covalent bonding. For example, Si(100) undergoes row pairing between surface atoms associated with the formation of π-bonds and hence also gives rise to a (1x2) reconstruction.
Surface Composition
Under normal conditions, constant bombardment of the surface by molecules. Kinetic Theory of gases gives:

where Z0 = 2.63 x 1024, and M is the molar mass of gas in g mol-1, and T is the temperature.
This means that the surface doesn’t stay clean for long (in air at 1atm each atom struck ~108 times per second).
It is possible to reduce the pressure using high-vacuum techniques. -104 Pa implies 1 hit per surface atom in 0.1s. Ultra-high vacuum techniques allow pressures as low as 10-7 to 10-9 Pa (one hit a day).
Surface Composition can be measured using a range of techniques –
Ionisation:
Detects contaminate (how clean) and layers of material later in experiment. Common feature is escape depth of electrons, i.e. the maximum depth from which they come (0.1 – 1nm). Hence it is only detecting surface species. It is achieved by the use of Photoelectron Spectroscopy.
X-ray Photoelectron Spectroscopy (XPS)
One of the most versatile techniques for analysing a surface chemically. A monochromatic beam of X-rays is incident upon a solid surface, causing photoemission from both core and valence levels of surface atoms into the vacuum. Core levels are defined as the inner quantum shells, which do not participate in chemical bonding, while valence levels are electrons in the more weakly bound, partially filled outer quantum shells.
The key to chemical identification is that core electrons deep inside atoms are largely insensitive to their surroundings when condensed into the solid phase and retain binding energies that are signatures of the atom type, i.e. the atomic number. By varying the energy of the photoemission effect (described Einstein’s Equation) it is possible to determine the atomic number of the atoms present at the surface by the kinetic energy of the ejected electron. It is also sensitive to properties such as Oxidation State. Hence, XPS fingerprints the materials present.
UV Photoelectron Spectroscopy (UPS)
The technique of UPS is similar in practice to XPS, but the energies used correspond to the study of weakly bound valence levels that participate in chemical bond formation. Lower energy UV photons exhibit a much narrower energy width and hence are more useful and offer better resolution.
The binding energies of adsorbates can be calculated in an analogous manner to XPS (Eb = hv – KE = φ), allowing identification.
Energy Loss Spectroscopy
Several kinds of vibrational spectroscopy have been developed to study adsorbates and to show whether dissociation has occurred.
Surface-enhanced Raman Scattering (SERS) – only useful for certain metals due to strong enhancement. Flat single crystal surfaces imply weak intensities.
Hybrid of PES & Vibrational Spectroscopy – Electron Energy Loss Spectroscopy (EELS, or High Resolution EELS) – the energy loss of a beam of electrons is monitored when they are reflected from a surface. Interpretation in terms of the vibrational spectrum of adsorbate (as for Raman).
High Resolution and sensitive particularly to light elements (X-rays insensitive to these) means that tiny amounts can be detected.
Auger Spectroscopy (AES):

The Auger Effect – emission of a 2nd electron after high energy radiation expelled another. The first electron departs and leaves a hole in a low-lying orbital, and an electron from a higher Energy orbital falls into it. The energy this releases may result either in the generation of radiation (X-ray fluorescence) or in the ejection of another electron:
The latter is the secondary electron of the Auger Effect. The energies of the 2o electrons are characteristic of the material, so the Auger Effect basically takes a fingerprint of the sample.
In practice, Auger spectrum normally obtained by irradiating the sample with an electron beam of energy (rather than EM radiation).
In scanning Auger Electron Microscopy (SAM), the finely focused beam is scanned over the surface and a map of composition is compiled. Resolution of 50nm is possible.
Surface-Extended X-ray Absorption Fine Structure Spectroscopy (SEXAFS)
SEXAFS uses intense X-ray radiation from a synchrotron – oscillations in the X-ray absorbance at the start of the absorption band arise from quantum mechanical interference between the wavefunction of a photo-ejected electron and parts of that electron’s wavefunction that are scattered by neighbouring atoms. Amplitude depends on constructive/destructive interference.
Hence, information about the number and distances of neighbouring atoms. Also shows that structures can reconstruct in response to adsorbates present.
Low Energy Electron Diffraction (LEED)
In LEED< incident electrons, elastically back-scattered (without energy loss) from a surface are analysed in the energy range 20-1000eV. Electrons in this energy range possess inelastic mean free paths of between ~5 and 20Å, and therefore may only travel a few atomic layers into the surface. Electrons in this energy range are excellent probes of surface structure because they possess de Broglie wavelengths of the same order of magnitude as the interatomic spacing between atoms/molecules at surface and, hence, may undergo diffraction if the atoms in the surface are arranged periodically.
The LEED apparatus ensures that only those electrons of kinetic energy Ep (the primary KE) reach the detector. If an ordered surface array is prepared, discrete electron beams emerge from the substrate whose spatial distribution reflects the symmetry of the ordered array. The diffracted electrons give rise a to pattern consisting of bright spots on a dark background, which reflect the symmetry and crystalline order of the surface.
From the LEED pattern, can obtain:
- From the position of the diffracted beams, the two-dimensional periodicity of the surface unit cell may be deduced, along with variations in the unit cell size induced by adsorption.
- From the variation of spot intensities with beam energy, the complete surface geometry, including bond lengths and angles, can be obtained. Sharp intensities indicate a well-ordered array, while diffuse suggests poor ordering, or impurities.
Scanning Tunnelling and Atomic Force Microscopy
SFM – Pt-Rh or W needle scans across (and very close to) the surface of a conducting solid. Electrons tunnel across the intervening space.
In constant-current mode, the stylus moves up and down corresponding to form and topography of the surface, including any adsorbates, so mapping the surface on an atomic scale.
In constant-z mode, the current is monitored for a fixed vertical position.
The tunnelling probability is very sensitive to the size of the gap between the stylus and the surface, so the microscopy can detect atomic-scale variations.
AFM – a sharpened stylus attached to a beam is scanned across the surface. The force exerted by the surface/adsorbate pushes or pulls on the stylus and deflects the beam. Deflection is monitored by interferometry or by laser. No current is needed, so can use non-conducting surfaces too.
Molecular Beam Techniques
Molecular Beam Scattering as opposed to exposing surface to gas. Advantage is that the activity of specific crystal planes can be investigated by directing the beam on to an orientated surface with known step / kink densities (measured by LEED).
Furthermore, adsorbate reactions at surface gives products that can be analysed as they are ejected, and pass into a mass spectrometer. Also, time of flight of a particle can be measured in terms of the residence time on the surface.
Temperature Programmed Desorption (TPD)
The desorption of adsorbed atoms and molecules is one of the most fundamental elementary surface processes and can provide information concerning the strength of the interactions between the surface and adsorbed species. In TPD, a temperature ramp is applied to the sample and the rate of desorption is followed by monitoring the amount of adsorbate desorbed into the gas phase as a function of temperature.
As the temperature rises, the thermal energy available becomes sufficient to break surface bonds. For the simplest case of an adsorbate in which the activation energy for desorption is constant as a function of coverage, a single desorption peak is obtained. Furthermore, as the experiment is performed in a vacuum chamber that is being pumped continually, the temperature at which maximum desorption occurs (Tp) corresponds to the maximum desorption rate.
This initially seems at odds with the Arrhenius Equation (for kd). A maximum is observed because, although kd increases exponentially with temperature, the surface coverage decreases simultaneously. The observed desorption kinetics are therefore a convolution of these two factors.
Subsequent analysis may yield:
- The activation energy for desorption (Ed).
- Information on the nature and strength of lateral interactions.
- The relative surface coverage of adsorbate.
The rate of the desorption process may be formulated as:
-(dN/dt) = kdNm
Where N is the number of adsorbed molecules, kd is the rate constant for the desorption process, and m is the order of the reaction. Making the substitution:

Where β = dT/dt (the heating rate), we can write:
-(dN/dT) = Nm (A/β) exp (-Ed/RT)
When T = Tp (thermal desorption peak maximum):
(d2N/dT2) = 0, which gives:

In particular, for first order desorption (m=1):

As β and Tp are experimentally measurable parameters, as long as A is known, the activation energy Ea can be evaluated.
I am happy for them to be reproduced, but please include credit to this website if you're putting them somewhere public please!