Organic Spectroscopy
Basics of interpreting UV, IR, Mass Spec and NMR for Organic compounds. Also has a useful shapes and shifts diagram at the end.
Organic Spectroscopy Notes
Basics of Spectroscopy
UV/vis, IR and NMR are all types of Absorption Spectroscopy, where EM radiation corresponding to exactly the energy of specific excitations in molecules is absorbed.
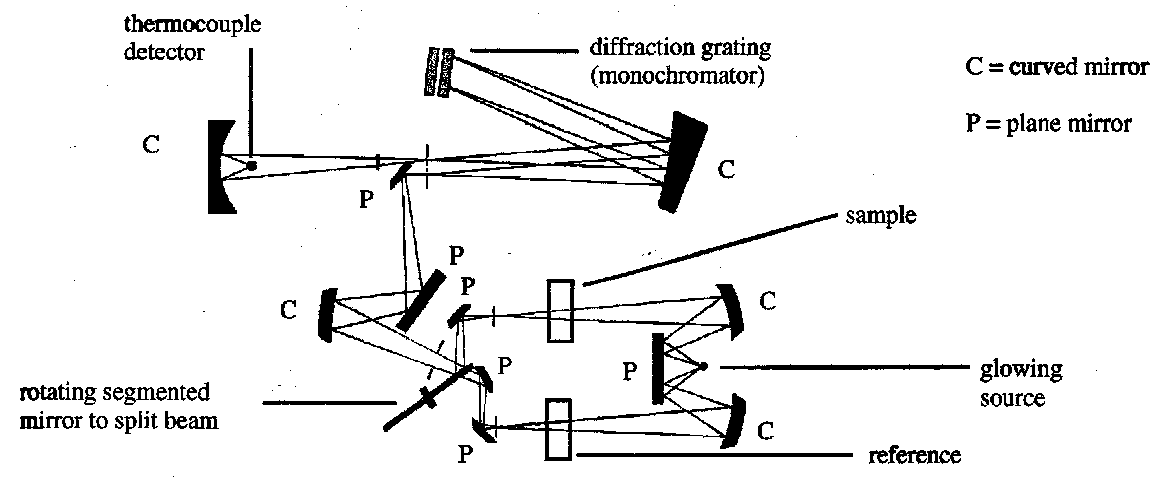
This is then measured by a spectrometer. These always consist of:
- The radiation source.
- The monochromator (continuous recording instruments).
- The sample container.
- The frequency analyser.
- The detector.
- The recorder.
Continuous recording implies scanning through a range of appropriate frequencies and producing the difference in detected intensities (relative to a sample) in a spectrum.
An alternative procedure is to use a Fourier Transform spectrometer. The sample in this case is subjected to a broad pulse of radiation covering the whole frequency range. The absorbed frequencies which are re-emitted as the excited molecules decay back to their ground states are recorded together and the complex signal is then broken down to its component frequencies by subsequent computer assisted manipulation. This can improve sensitivity and is usually faster.
Mass Spectrometry is completely different from the above, however. It doesn’t involve absorption of EM radiation, and is hence known as spectrometry as opposed to spectroscopy. It analyses sample molecules one at a time rather than the bulk sample. Its primary use is obtaining the molecular weight of quite large and complicated molecules.
Ultraviolet/Visible Spectroscopy
Rarely used as a first analytical tool now, as it doesn’t show much information. Organic molecules always absorb UV radiation in the region below about 150nm, as this corresponds to the σ framework. Solvents typically absorb up to 200nm. Hence, scan at 200-400nm to avoid these.
Lone pairs (n) and π-electrons are more mobile, as they require less energy for excitation to their antibonding orbitals, and so we see conjugated systems at longer frequencies, e.g. butadiene π→π* corresponds to 217nm.
It is conjugated systems, such as polyenes and poly-ynes (referred to as chromophores), that give rise to diagnostic absorptions in the UV-visible region of the EM spectrum. For unsaturated systems the most commonly observed transition is π−π* and n-π*.
The spectrometer shows A vs. λ, where A = log (Io/I) = εcl (the Beer-Lambert Law). This comes from:
Beer’s Law – absorption is proportional to the number of molecules.
Lambert’s Law – Io/I is constant for our range of Io.
ε is the extinction coefficient, c is the concentration, and l is the length, usually 1.
It is possible to find λmax and εmax from each peak on the graph.
Examples:
|
Allene |
Not conjugated, not seen. |
|
trans-PhHC=CHPh |
Planar, p overlap. λmax = 296nm, ε = 31600 cm2 mol-1 |
|
cis-PhHC=CHPh |
Twist → p not fully overlapped. Hence, λmax = 280nm, ε = 4000 cm2 mol-1 |
Woodward’s Rules can be used to predict λmax (based on steroids). Conjugation increases the wavelength, corresponding to a smaller energy of transition between π−π*. So phenol is basic in solutions shows a λmax = 298nm compared to only 255nm in acid. This is due to the negative charge on the oxygen in the phenoxide ion being fully conjugated with the ring.
UV Spectra functional groups are hence:
|
Dienes |
λmax ~ 230nm |
|
α,β-unsaturated ketones |
λmax ~ 220nm |
|
Phenols |
|
|
Benzenes |
|
Can hence see why it is not that much use as a first analytical tool!
Infrared Spectroscopy
Spectrometer
Theory
From simple harmonic motion, it is noted that frequency of oscillation increases with the stiffness of the bond, and decreases with the reduced mass. A bond will absorb at the energy corresponding to one of its resonant frequencies of oscillation, therefore the absorbed frequency is proportional to the inverse square root of k. k is the force constant, which is characteristic of the bond.
Molecular vibrations occur in the range 2500 to 15400nm. Wavenumber of absorption is then plotted against transmission.
The peak width is related to ε, which is proportional to the dipole change squared. Thus, broad peaks are usually a result of H-bonding or increased concentration. This can be useful, e.g.
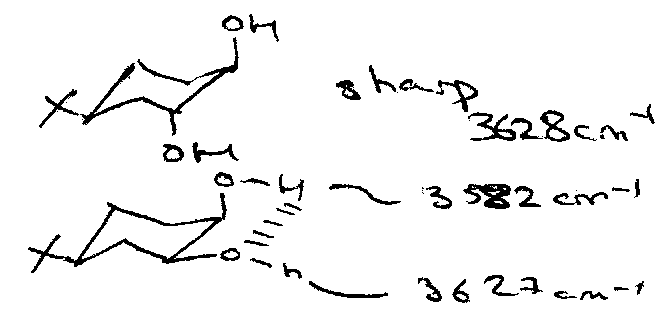
Peak appearance can also vary for different functional groups. For example, an alcohol OH gives a smooth broad peak, while the carboxylic OH (which is in the same frequency range) has a wavering line instead.
Carbonyls
Influences on position:
|
R-CO-X |
Increasing electronegativity of X increases wavenumber. |
|
α,β-unsaturated ketone |
Decreases wavenumber by 15-40cm-1, except in amides. |
|
Ring strain |
Increases wavenumber (large) – distinguishes ring size. |
|
(Intramolecular) H-bonding to the carbonyl |
Decreases wavenumber by 40-60cm1 |
Typical peaks
|
3600 |
Sharp |
Free OH |
|
3500-3000 |
Broad |
H-bonded OH, amine or amide |
|
3300 |
Sharp & Strong |
Alkyne-H bond |
|
3100-2700 |
|
Alkane-H bond. Stronger for sp3 than sp2. |
|
3500-2500 |
Broad |
H-bonded carboxylic OH |
|
2200 |
Weak |
C≡C |
|
1850-1650 |
|
C=O |
|
1650-1500 |
Weak unless conjugated |
C=C. Absent for symmetrical alkenes. |
|
Fingerprint region |
|
C-O, C-Cl, aromatics, NO2, P=O, SO2. |
Note that the carbonyl stretch can be sub-divided further:
|
1750-1850 |
C(O)X system |
|
1740 |
Ester |
|
1730 |
Aldehyde |
|
1710 |
Ketone |
|
1650-1690 |
α,β-unsaturated |
|
1670 |
Amide |
Mass Spectrometry
Individual molecules are bombarded with high energy electrons which cause the ejection of one or more electrons form the substrate on impact (electron impact ionisation). The positively charged ions are then accelerated along an electrical potential through a magnetic field which causes them to be deflected to an extent which is dependent upon the charge on the molecule and the magnetic field strength, and is inversely dependent upon the momentum (i.e. mass).
Chemical ionisation can also be used for molecules too fragile to withstand the 70eV bombardment. This transfers either H+ or NH4+ to M, giving [M+1]+ or [M+18]+ respectively. This does not lead to fragmentation in the way mass spec does, and so it is used solely to determine Mr.
Interpretation
The molecular ion peak relates to the loss of a single electron from the target molecule due to a bombarding of electrons. The molecular ion (M+) has the same mass as M, and so gives the mass of the compound. This might however be an unstable ion, and so no molecular ion peak can be recorded in the detector. In this case, a milder (chemical) ionisation technique could be used.
It should be remembered that isotope effects exist (e.g. 1% of the carbon will weigh 13u instead of 12u). This can actually be useful for determining proportions of isotopes, since the peaks responsible for each isotope can be compared.
The Nitrogen Rule
Nitrogen is the only commonly encountered odd valency element possessing an even atomic weight in organic molecule. Any compound containing one or an odd number of nitrogen atoms will have an odd molecular weight; conversely, compounds lacking nitrogen or containing even numbers of nitrogens have an even molecular weight.
Fragmentation Pathways
The fragmentation that occurs can give us the structure of the molecule as well. Fragmentations often occur at labile bonds or to give particularly stable fragments. Fragmentation may involve cleavage of a single bond or cleavage of two bonds.
One-bond Cleavage –
Radical cations may fragment by either heterolytic cleavage to give a cation and a radical, or homolytic cleavage to generate a new radical cation. However, cations only degrade by a heterolytic process, as homolytic cleavage is energetically unfavourable. This leads to the even electron rule, a guideline which states that even-electron species do not fragment to odd-electron species. In other words, a cation will not fragment to form a radical and a radical cation. One-bond cleavage gives fragments that are valence unsatisified.
Two-bond Cleavage –
These result from chemical reactions of the radical cation. Even molecular weight compounds give even molecular weight two-bond cleavage fragments, and vice versa. This makes their cleavages easy to identify.
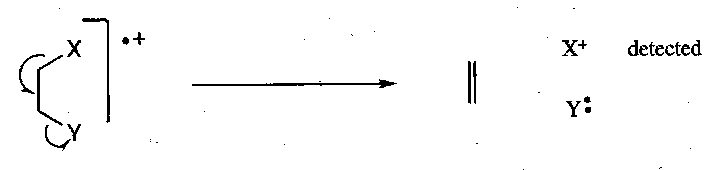
The fragment that retains the charge and is detected can be predicted by the Stephenson-Audier Rule, which states that the positive charge will reside on the fragment with the lowest ionisation potential (i.e. that which is most able to stabilise it, either inductively or by resonance).
Common Fragmentation Pathways
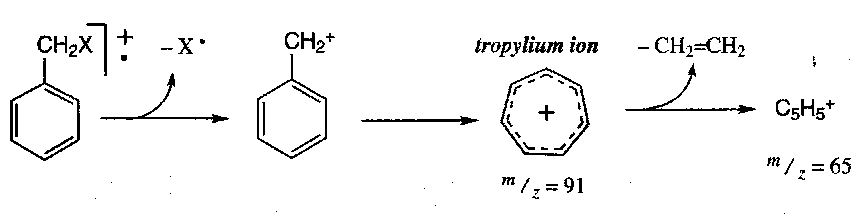
Tropylium Ion
Acylium Ion
e.g. acetates and methyl ketones give a strong peak at m/z = 43, and phenyl ketones a strong peak at m/z = 105. These are peaks corresponding to the subsequent extrusion of CO.

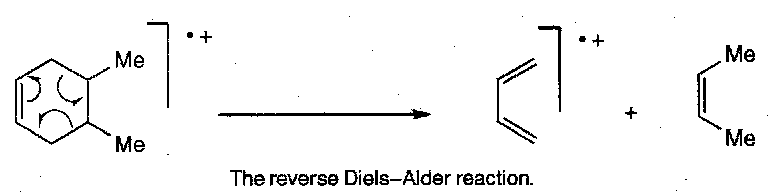
Reverse Diels-Alder
McLafferty Rearrangement
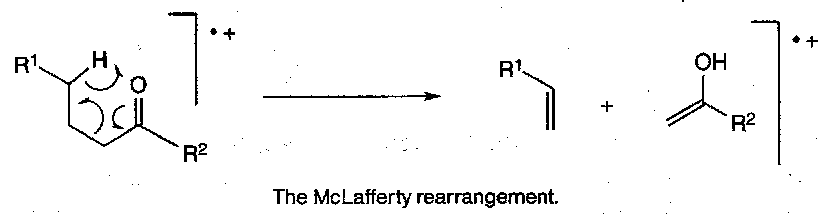
Reverse ene reaction – also observed in esters, acids and amides with a suitably positioned γ-hydrogen.
NMR Spectroscopy
Proton NMR
1H has spin = ½ giving 2 possible orientations in a magnetic field, either against the field or in the same direction. The energy difference between these states is small (10-4kJ mol-1) and they are populated to roughly the same degree. Excitation with radiowaves cause excitation of the nuclei to the higher energy state. When they fall back to the lower energy state they re-emit a radiofrequency photon, thus enabling the frequency at which the resonance condition is reached to be measured. This energy (frequency) is dependent on the chemical and magnetic environment which a particular 1H proton is found in, and NMR can be used to elucidate structure by knowledge of at what frequency (or chemical shift) protons in a particular environment show peaks at.
Coupling
On an NMR plot, the peaks often show multiplicity, due to a coupling interaction between neighbouring protons. This spin coupling can be explained using the following fragment on the right.
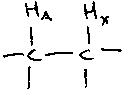
HA experiences not only the applied magnetic field (and its own) but another field due to the presence of HX. The proton at X can itself be either aligned with or against the magnetic field. The orientation of the spin at X is relayed through the electrons in the bonds, allowing HA to sense it. So instead of HA showing a singlet absorption at A ppm, a doublet is observed with peaks at A+½J and A–½J where J = coupling constant. J is field dependent, and symmetrical in the sense that the peak for HX is also split to the same degree by the presence of HA.
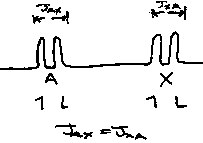
J is the difference between the resonant frequencies for a particular proton caused by the presence of another proton which either decreases of increases the local field around HA.
The probability of the two spin orientations of A and X is equal, and so the peaks are of equal intensity. This type of coupling is observed in trans-cinnamic acid which has the structure:

In 1,1,2-trichloroethane, there are two HX protons. This gives 4 possible spin orientations with respect to HA; both parallel, both anti-parallel, or one parallel and one anti-parallel. This gives rise to 3 peaks with the parallel/anti-parallel peak being double intensity, so they are in the ratio 1:2:1. This is known as a triplet, corresponding to three distinct energy situations.
The multiplicity of a peak can be predicted by the n+1 rule. If we have the following:
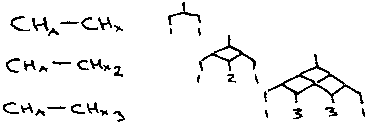
In the first case, HA couples HX, and so a doublet is observed (1+1 = 2). A triplet and a quartet are observed for the other two systems. The intensity of each peak can be found using Pascal’s triangle. In all these systems, the HX peak is a doublet, because HX only sense the single HA proton and not the HX’ and HX’’. Equivalent spins do not show coupling amongst themselves. It can be seen that generally, for n equivalent neighbours, there are (n+1) lines.
Also note diastereotopic groups, e.g. CH2 adjacent to a chiral centre:

These simple rules of analysis only apply within the weak coupling approximation where Δσ ≥ 10. Strong coupling makes the analysis more complex and can be reduced by having a large field. In strong coupling the centres of resonance multiplet may not reflect the true chemical shifts, line splittings may not represent true coupling constants and due to roofing effects the intensities become distorted.
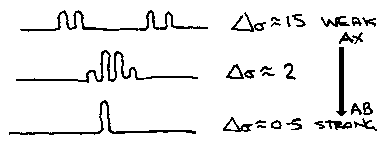
When Δσ is small, the HA and HB absorptions are so close together that they do not couple because they have become equivalent. A similar example is the AMX system. In this system, strong coupling between AM distorts the spectra, in addition to the roofing of AM, X splits into four lines. This virtual coupling cannot be explained using the first order approximation.
Coupling pathways do not extend throughout the whole molecule, and coupling efficiency falls off with the number of intervening bonds. Geminal couplings, between protons on the same carbon (2J) generally are between -10Hz and -15Hz for saturated CH2 (much smaller for unsaturated). Electronegative groups make J more positive, so coupling falls. They are of limited use in structure elucidation.
A three bond coupling (vicinal) is more useful, and the magnitude of J is related to substituent effects, bond lengths, bond angles and dihedral angles. For a saturated system, 3J ≤ 14Hz and for unsaturated 3J ≤ 18Hz. J becomes smaller with electronegative group on the CH-CH pathway. The coupling between the 1,2 protons in benzene and cyclohex-1-ene is larger for the cyclohexene, as the pathway has full double bond character, and so is shorter than in benzene with the longer aromatic bond (10Hz vs.8Hz). J also depends on the bond angles, as demonstrated by considering the series cyclohexene → cyclopentene → cyclobutene, where J decreases from 10 to 3 Hz.
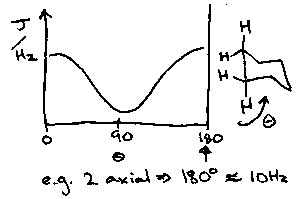
The Karplus Curve gives the variation of 3J with φ where 3J = A – B cos φ + C cos 2φ where A, B, C depend on the substituents. This factor is dictated by the orbital overlap.
This enables us to see that in alkenes 3Jtrans > 3Jcis, and that in cyclohexanes, 3Jax-ax > 3Jax-eq = 3Jeq-eq.
The longer range couplings are typically much smaller (3Hz) and operate only over particular pathways.
Typical Coupling Constants:
|
CH2 |
10-15 |
H-C-C-H |
7 |
HC-CH=C |
5-7 |
C=CH-CH=C |
10-15 |
|
C=CH2 |
1-2 |
HC=CH (cis) |
8-10 |
HC=CH (trans) |
14-16 |
H-C=C-CH |
0-1 |
|
H-Ph (ortho) |
7-8 |
H-Ph (meta) |
1-2 |
H-Ph (para) |
0-1 |
HC-C=-C |
2-3 |
Protons which are magnetically inequivalent show couplings with each other and so display multiplet structures. Protons which are magnetically equivalent are necessarily chemical equivalent, but not vice versa. So where as in CH3CHCl2 the methyl protons are magnetically equivalent and couple to H2 in exactly the same way, the protons in H2C=CF2 are not magnetically equivalent.
Intensities
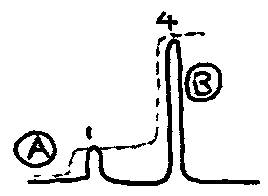
An NMR plot reveals not only the chemical environments of 1H nuclei, but the number of nuclei in that environment. The area under a peak relates to proportionally the number of nuclei in that environment.
The simple spectrum above indicates that there are four times as many nuclei in the environment corresponding to B as there are in A. This means there must be four equivalent protons in the B environment.
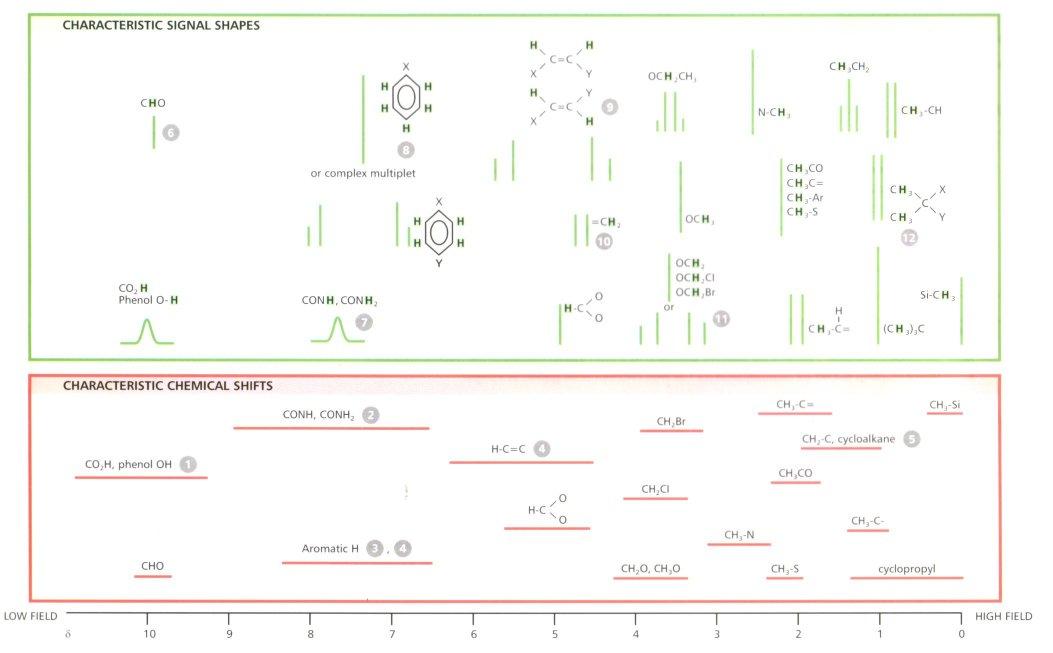
Chemical Shifts
The energy of transition (chemical shift) is measured in units of ppm and as mentioned previously relates to the functional group environment that the proton is found in. Chemical shifts are independent of the magnetic field strength, but the dispersion increases with the field as absolute frequencies increase. The anisotropic effect is a result of the asymmetry of electron density in bonds, and is most pronounced in unsaturated systems with circulating π-electrons, such as alkenes and allenes.
Protons found within the plane in alkenes are said to be deshielded and are shifted to the high frequency end of the spectra. In comparison, the protons within the core of an alkyne are highly shielded, and so give rise to a resonance at lower frequencies. This is caused by the fact that lower electron density about the nucleus influences the degree of nuclear shielding. Electronegative groups such as NO2 remove electrons from the 1H nucleus and deshield it, where as –Et shield the nucleus and force the absorption to lower frequencies. In conjugated systems where several resonance forms can be drawn, a positive charge on one atom means the adjacent proton is deshielded and there is a higher shift observed as in methyl benzoate.
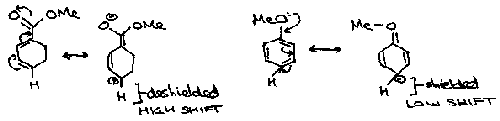
Aromatics often show very large shifts due to ring currents. The applied magnetic field induces a current in the ring which produces its own magnetic field.
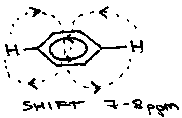
Outside the ring, these fields add, and so a larger than expected shift is observed. In larger aromatics, with hydrogens inside the ring, shifts of -3ppm are observed.
Carbon-13 NMR
13C has spin ½ and so is also NMR active, making in an alternative to 1H NMR. 13C has low natural abundance, and so 13C-13C homonuclear coupling is insignificant and 13C-H couplings are removed by broadband proton decoupling for a clearer spectrum. The spectra have a simple appearance with a single line for each carbon site. The chemical shifts for 13C are roughly 20 times that of the attached proton. CO is typically at about 160ppm and alkanes at about 20ppm. Symmetry in the molecule gives rise to equivalent peaks.
I am happy for them to be reproduced, but please include credit to this website if you're putting them somewhere public please!